The Detection of Transient Subduction Zone Interface Properties Using Teleseismic Data
Last modified: June 04, 2026 | First published: May 13, 2026
Using seismic waves recorded thousands of kilometers away, this study published on GRL demonstrates a new way to remotely detect fluid-driven changes along subduction faults, opening powerful new opportunities to monitor megathrust slip behavior in offshore regions where direct observations remain extremely limited.
Introduction
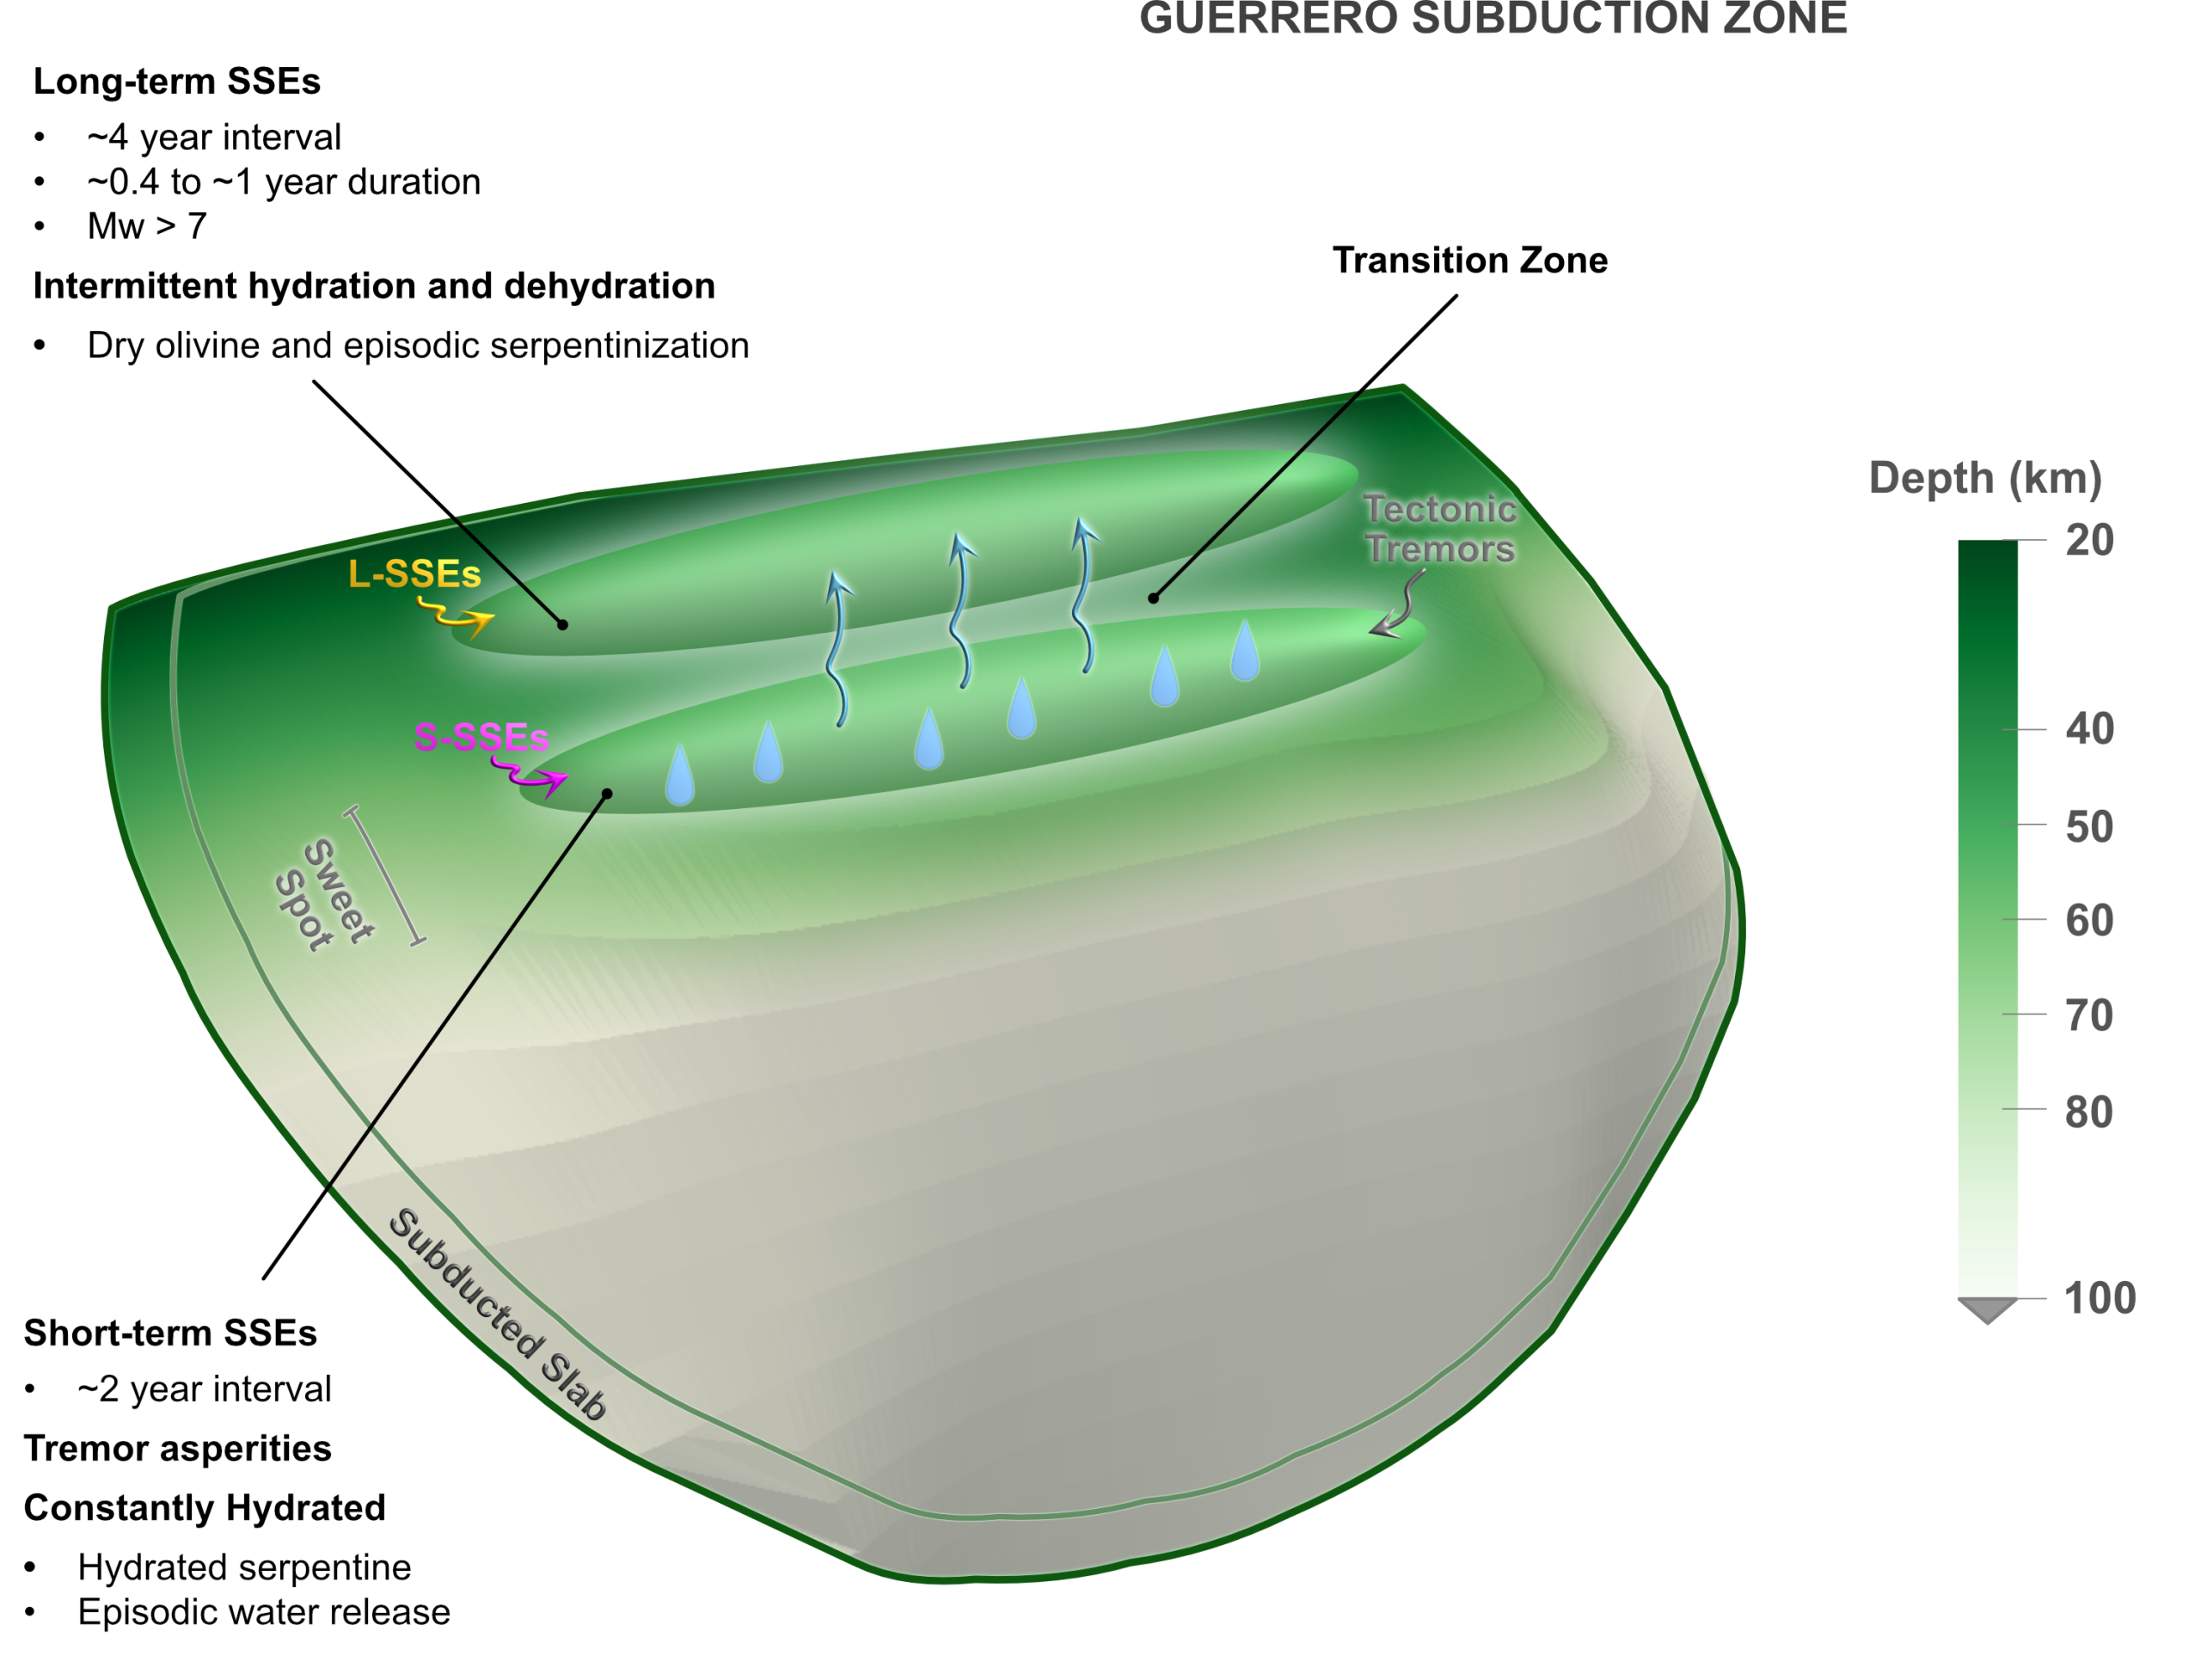
Subduction zones—where one tectonic plate dives beneath another—are among the most important and hazardous tectonic environments on Earth. They generate the world’s largest earthquakes, tsunamis, and a wide spectrum of deformation styles ranging from sudden seismic rupture to slow, silent slip. Over the past two decades, it has become clear that fault motion along these plate boundaries is not uniform: in addition to large earthquakes, many subduction zones host slow slip events (SSEs), during which the fault gradually releases strain over days to months without producing strong shaking.
A key factor controlling this spectrum of slip behavior is thought to be the presence and pressure of fluids along the subduction interface. Elevated pore-fluid pressures can weaken faults, reduce frictional resistance, and promote stable or transitional sliding rather than brittle failure. These fluids are produced through dehydration reactions in the subducting slab and may migrate along permeable layers at the plate interface, but their spatial distribution and temporal variability remain difficult to observe directly.
Geodetic techniques such as GPS have been instrumental in identifying SSEs and mapping surface deformation, but they are largely restricted to land and provide limited access to offshore or deeper parts of the megathrust. Seismological approaches offer complementary insights, particularly through observations of tremor and low-frequency earthquakes, yet these also typically require dense local instrumentation and are challenging to deploy in marine settings.
In this study, we explore a different approach: instead of relying on local networks, we use teleseismic recordings of intraslab earthquakes to probe the subduction interface from afar. We focus on subtle seismic phases generated by reflections from ultra-low velocity, fluid-rich layers at the plate boundary. By analyzing how these signals vary in space and time, we investigate whether remote seismic data can capture signatures of changing interface properties and whether these variations relate to slow slip behavior in the Mexican subduction zone.
Method
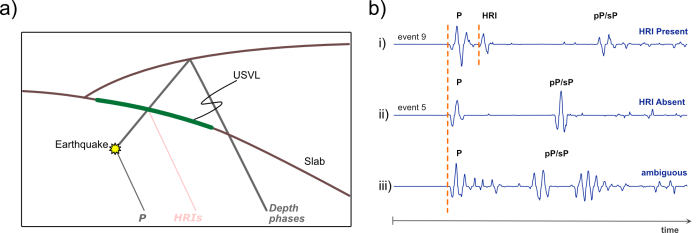
We use teleseismic recordings of intraslab earthquakes (Mw ~4–6, 30°–90° epicentral distance) recorded by small-aperture seismic arrays. These events are selected to ensure clear separation in time between the direct P arrival, potential interface reflections, and the main depth phase (pP).
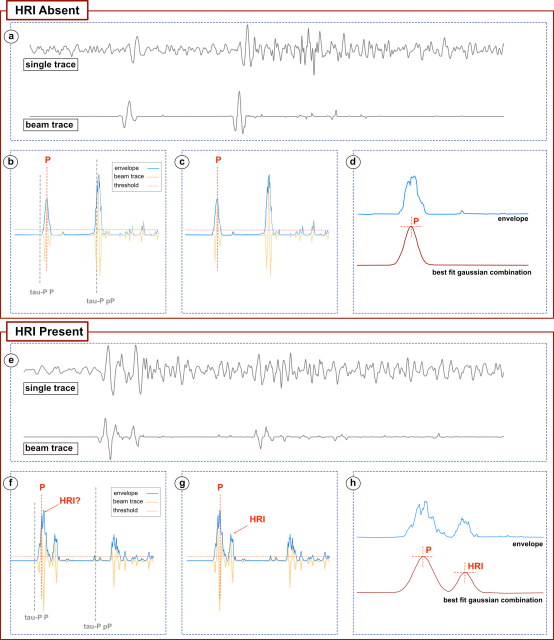
Waveforms are band-pass filtered (0.5–5 Hz) and processed using array beamforming to enhance weak signals and suppress noise, producing high-quality stacked traces with improved signal-to-noise ratio. Within these beams, we systematically search for small intermediate arrivals between P and pP that are consistent with underside reflections from the subduction interface.
To automate detection, we analyze waveform envelopes in the P–pP time window and classify each event based on the complexity of the signal: (i) a single dominant arrival (no reflection), (ii) a clear additional phase consistent with a reflected arrival, or (iii) ambiguous cases where signal separation is not robust. This classification is supported by strict quality control on array coherence, slowness-backazimuth consistency, and beam stability.
The resulting dataset allows us to map spatial and temporal variations in seismic reflectivity along the megathrust and relate them to known slow slip regions in the Mexican subduction zone.
Results & Discussion
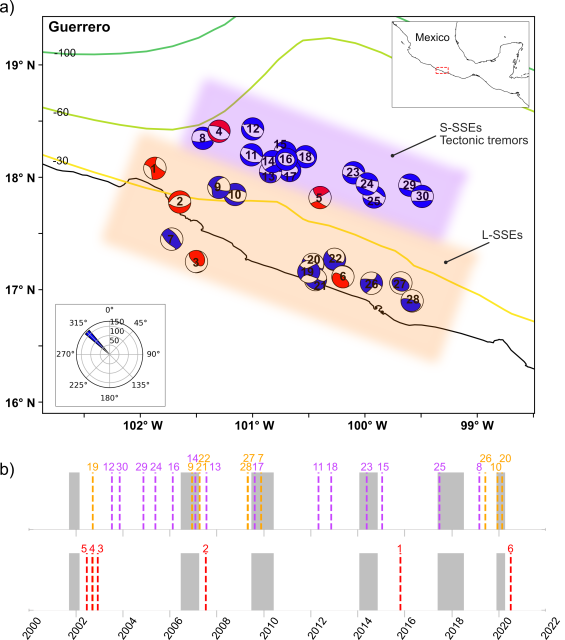
By analyzing seismic data recorded by arrays located thousands of kilometers from the study area, Rappisi et al. identified signals consistent with the presence of ultra-slow seismic velocity layers along the Mexican subduction interface. These layers are interpreted as fluid-rich regions with elevated pore pressure — conditions that are known to promote slow slip.
The study shows that these signals cluster in the same regions where slow slip events have previously been documented, suggesting a strong connection between fluid distribution, slab geometry, and fault behavior. In some regions the signals appear persistent through time, while in others they seem to occur preferentially during periods of slow slip activity.
The work introduces an innovative, scalable, and cost-effective approach for investigating deep tectonic processes that are otherwise difficult to observe, especially in offshore environments where traditional geodetic measurements are limited. This method could help improve our understanding of subduction zone dynamics and contribute to better assessments of earthquake and tsunami hazards worldwide.